The modern timeline is a fait etabli – it is a horizontal or vertical line, flowing from left to right or top to bottom, organizing events in their order of occurrence, spaced evenly in order for the graphic to be read intuitively. However, upon further investigation it becomes clear that the timeline is a cultural construction, and when its invention is traced and considered historiographically, the implications of this construct or not dissimilar from that of other notable graphic conventions, such as linear interrupted text or perspective.
It is not widely known that information graphics do not spring naturally from our impulse to communicate, but instead have a history. The left-to-right timeline, which uses the measure of space as an approximation for the measure of time, can be traced back to Joseph Priestley (1733-1804). Using linear axes, colour, symbols and text, he experimented with ways to present data in a easily decipherable graphic manner. This style of the timeline has largely been accepted as the status quo, and thus is an integral part of the scaffolding of reality and of the manner in which we interpret data.

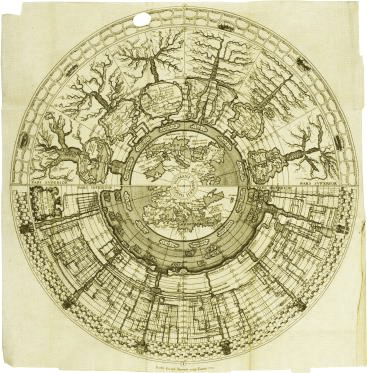
The advancements made in cartography led to the visual fusion of space and time. The conquest of foreign territories and resources necessitated the invention of new technologies which made possible increasingly precise measurement and ignited a desire for an expansive understanding of place and time. Albeit delayed by more than two hundred years, visual evidence of this phenomenon exists in abundance in the explosion of graphic chronologies that ensued, an example being the Martignoni map, on which time becomes measured geographic space, flowing radially from the spring which is the Roman Empire. As space is not one-dimensional, a linear organization simply did not work, and thus in this image the radial (outward) dimension functions as the future axis of time.
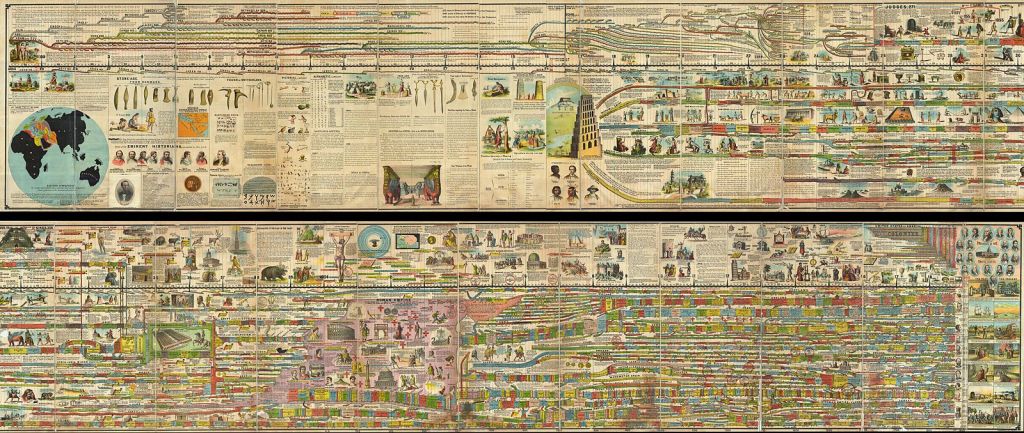
The Adams’ Panorama of History follows a similar structure as Priestley’s time charts, and is likely inspired by him. A central linear temporal axis sorts the wars, births, deaths, inventions, events and empires listed chronologically, but upon closer examination, it becomes clear that this timeline is actually an amalgamation of dozens of smaller timelines. The timeline is overtly biblical, as it begins with Eden, other civilisations entering the chart ad hoc. (It should also be noted that most chronologies have theological origins, making this timeline a modern continuation of a long-standing tradition). The author acknowledges the truism in which time when (chronology) and the place where (geography) are the two eyes of history, a saying whose origins are subject to debate, but which has in circulation since the sixteenth century (usually attributed to Ortelius (1570) or James A. Garfield (c. 1870), but both of these are likely incorrect).
Similar to Priestley, Adams depended on colour for legibility, but also used illustrations with subtitles, symbols, maps and numbers, which makes evident that he was searching for a comprehensive and total history, and therefore he did not achieve the distillation of information that made Priestley’s timelines the universal norm. Both timelines are an act of self-realisation: they position the human in a finite, absolute temporal space, rendering history material and knowable.
What is also worth noting is the dendritic nature of the timeline – the colourful bands which separate the different “streams” of time almost resemble roots. This becomes especially interesting when the early upper left section of the timeline is considered, which shows archeological finds (sorted between 3700 and 3300 BC), where the author adds “Fac simile of implements found and representing the civilization of man in what may be called with propriety “The Stone Age of Man.” Fix that time yourself.” The acknowledgement of contemporary scientific discourse surrounding archeological finds, when juxtaposed with the dendritic nature of the chart and also with its obvious biblical intentions, is certainly interesting, however not novel, as the motif of the “stream of time” predates Adams.
Architectural Timelines
With the history of chronographics clarified, it is interesting to examine the history of architectural timelines. Although my research on the subject has only begun, I am fascinated by the scarcity of graphic timelines which exist in such a visual field, with only a few well-known examples.
The most basic architectural timelines all follow the universal standard model, as one would imagine. The image below is an example of a linear timeline that shows the evolution of (Western) architectural styles, both through text, spatial distance and architectural drawings.
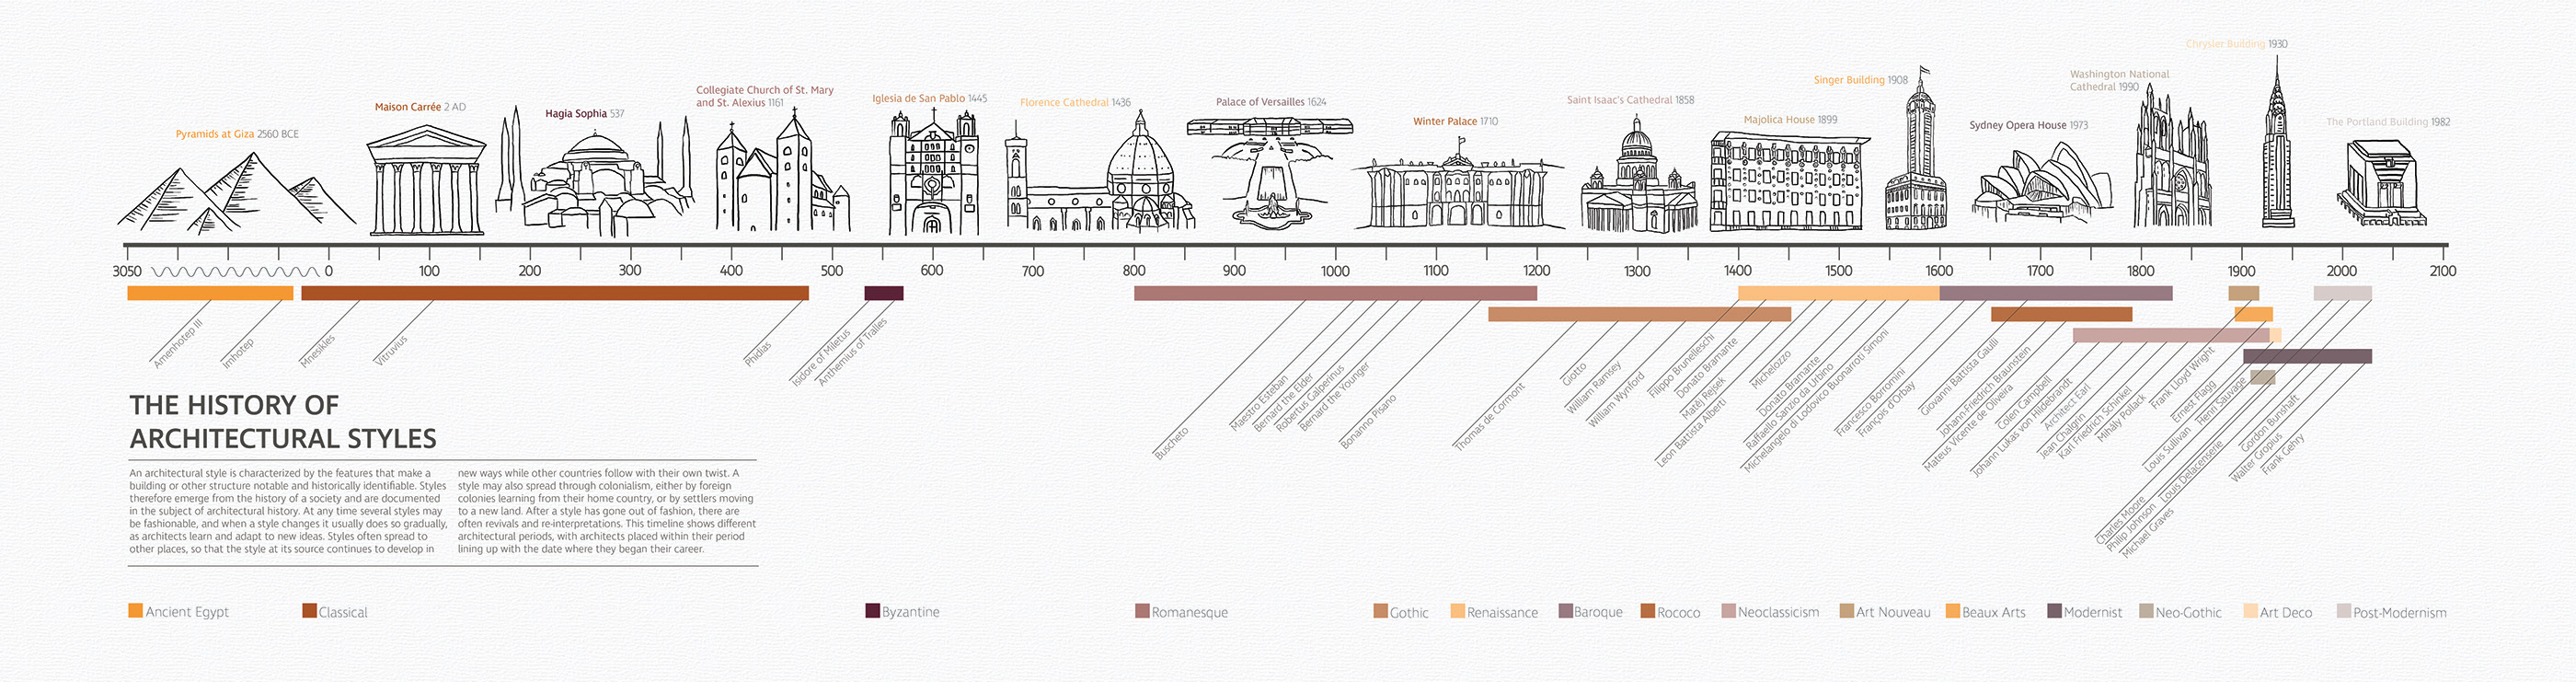

The styles are plotted on a linear x-axis, enabling a proportional reading and a comprehensive overview of (European) architectural styles since 1000. Below is the first result when one searches up ‘architectural timeline,’ generated by Wikipedia.

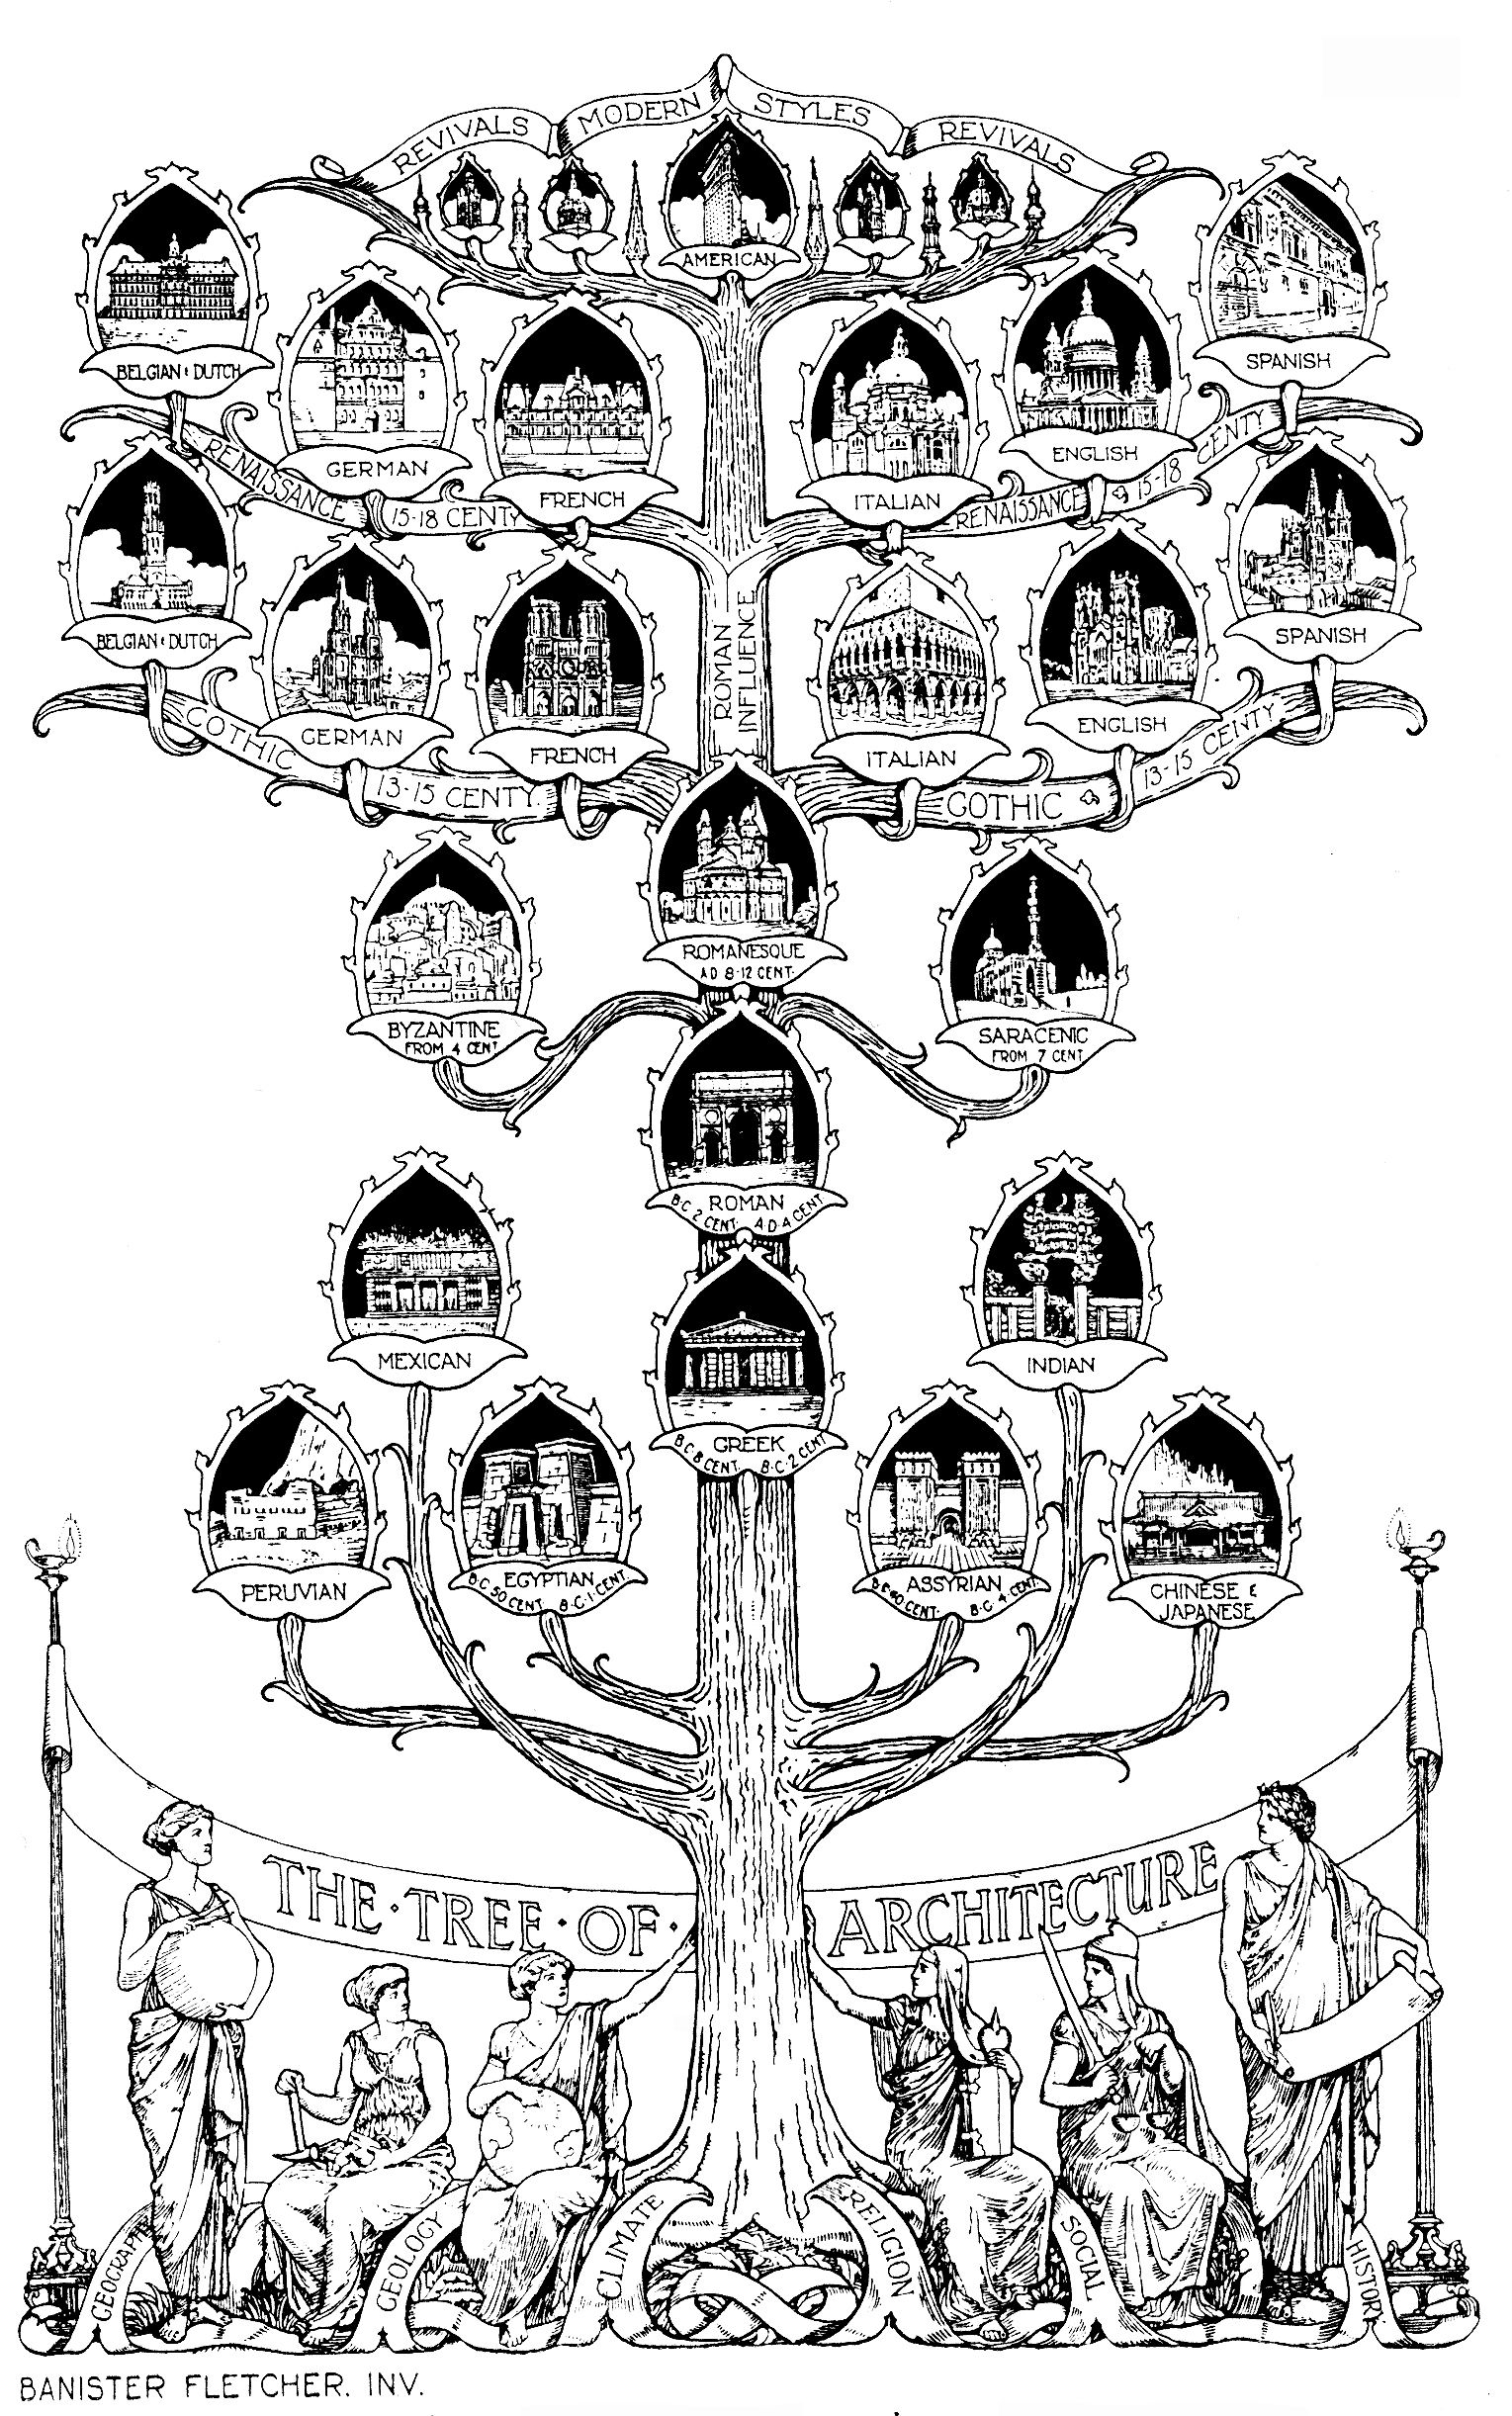
It is not surprising that most chronologies of architectural styles follow the left-to-right spatially-measured standard, but there have been deviations, the most famous modern probably being the “Tree of Architecture” by Banister Fletcher. Similar to Adams’ Panorama of History, time is represented as branching off from a common origin, the origin in this case not biblical, but of Greco-Roman architecture, identical to the Martignoni map. The origin is rooted in geology, climate, religion, geography, society (social) and history. The chart illustrates the growing architectural complexity of the preceding centuries, an ordered branching from a common origin. The biological theme is significant, as it epitomised emergent ideas in architectural theory, but also the beginning of the end of the division of architecture into distinct stylistic periods.
The evolutionary model of architecture culminates in Charles Jencks’ Evolutionary Theory of Architecture, the second iconic architectural timeline. In this information graphic, Jencks attempts to make sense of architectural influences and their coagulation into distinct styles from 1900 to 2000. This timeline is unique as it is not teleological, and because it is stable, suggesting that architecture had reached a sort of stasis in which movements replaced each other at roughly the same rate as which they were born, partially severing architecture from ideologies of eternal progress (but not fully, as the use of the word ‘evolution’ implies improvement). While the graphic representation is largely stylistic, thus making it an “impure” information graphic, the x-axis is linear, allowing a measured reading of the information presented. Jencks does not attempt to define an origin point, instead focussing on a small period which arises from certain architectural ideologies: “logical,” “idealist,” self-conscious,” “intuitive,” “activist,” un-self-conscious/80% of environment,” demonstrating a relativistic quality.

A central tenet of architectural postmodernism is the dismissal of style – functionalism refused to acknowledge itself in this manner, and was instead posited as a new chapter, in sync with technological achievements, making it impossible for architecture to participate in stylistic chronologizing and instead condemning it to accept the rational, scientific left-to-right chronology, an integral part of how we depict data.
Jencks’ graphic is an attempt to create an architectural timeline that loosely conformed to these conventions, but simultaneously rejected them, signalling the difficulty with which architecture fits into the contemporary scientific framework – causality is not easily traced, and the field responds to complex feedback mechanisms, technical innovation, social and cultural changes, styles, trends, history, etc.
The complexity of the milieu in which space is designed and of the causal network which influences architecture leaves great potential for architectural chronographics.
Architecture as Flux and Eternity Signal
As all contemporary architecture critics recognize, of course, it is impossible to remove architecture from its stylistic connotations, the most notorious example being Mies’ decorative use of i-beams.
The impressions left on architecture by recognizable visual styles enable it to function as a time repository, as made evident in the first architectural timeline shown – if the drawings of buildings were to be isolated, the graphic would still function as a rudimentary timeline – there is a clear temporal vector that can be deduced. The image below, illustrating the evolution of the Roman columnar capitals is an excellent example, where the orders become symbols of stylistic progress, the sequence itself becoming a timeline of sorts.

Fascinatingly, architecture, when used as a symbol, has semiotic implications of both flux and of eternity. The connotations of stasis, strength, power and permanence can be found everywhere: on our banknotes, in the politicisation of certain architectural styles, but notably also in early chronographics.

The first known Western chronologies are Eusebian tables, which function as historical indexes, recording events vertically, often used to determine the order of biblical events. The form of these tables has remained remarkably consistent over time, following a general morphology that can be traced back to the Chronograph of 354, which is a compilation of chronological and calendrical texts, created for a wealthy Roman Christian – here, once again, we see the Christian fascination with time – instead of a relationship with eternity, Christian religion introduced an ideology in which creation was in the distant past, and the end of times were in the imminent future, spurring a chronologizing impulse. The chronograph is positioned directly between Roman chronographics and the emergent Christian chronographics (it is also positioned right at the end of the pagan period), as it uses both allegory and the directional list, which contained the seed of the modern timeline.

Here, the architecture and the timeline converge head-on, but architecture is not a symbol of evolution and temporality, but instead one of permanence: it anchors the fluidity of time and the variability of the timeline on the page, compensating for the lack of stasis and solemnity of the text, fixing it within the discernable realness of physical objects.

The duality of the symbolic function of architecture, encompassing both the passing of time and the stasis of eternity, enables one of its most powerful roles, which is the one it plays within politics, functioning simultaneously as a metaphor for history and legitimacy, but also as a propagandistic tool for visions of progress. The time-symbolizing nature of architecture brings important questions to the forefront when Fletcher and Jencks’ timelines are considered, positioning the discipline at the the convergence of an idealised past and future.
